
Knowing whether your cost per lead is healthy requires knowing what’s normal in your industry. According to WordStream’s annual advertising benchmarks report, CPL varies dramatically across industries — but most business owners have no idea where their numbers fall. Here are the 2026 CPL benchmarks by industry.
Cost Per Lead Benchmarks by Industry
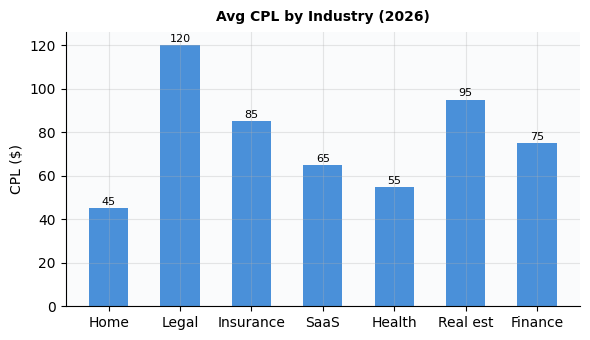
These ranges represent typical CPL for Google Ads and Facebook Ads combined, based on aggregated data from thousands of SMB accounts:
- Legal services: $50-100 per lead. High competition, high intent, high lifetime value.
- Home services (plumbing, electrical, HVAC): $15-40 per lead. Local competition drives variability. Service area and seasonality matter.
- Ecommerce (general): $5-15 per lead. Low CPL but also lower conversion to sale. Most ecommerce CPL goes to product page visits, not qualified leads.
- Healthcare and medical: $30-80 per lead. Highly regulated, high competition, moderate conversion rates.
- B2B SaaS (under $100/mo): $50-150 per lead. Long sales cycle, high LTV, high competition on most keywords.
- Real estate (agents and brokers): $20-60 per lead. Location-specific, seasonal, with wide variation based on market conditions.
- Auto dealerships: $25-50 per lead. High competition but clear purchase intent.
- Education and training: $20-60 per lead. Highly seasonal (peaks in Jan, Aug-Sep).
- Financial services: $60-150 per lead. High regulation, high LTV, high competition on core keywords.
- Restaurants and hospitality: $3-10 per lead (dine-in), $10-25 per lead (catering/events). Low CPL for direct dining, higher for events.
Important note: These are broad ranges. Your actual CPL will vary based on location, competition in your specific market, the quality of your ads and landing pages, and your targeting precision. Use these as sanity checks, not absolute targets.
Why CPL Varies So Much by Industry
Three factors drive CPL differences across industries:
1. Purchase complexity: Simple purchases (a pizza, a t-shirt) have low CPL because the path from click to purchase is short. Complex purchases (legal services, B2B software) have higher CPL because the decision process involves more research and consideration.
2. Competition density: Industries with many advertisers bidding on the same keywords have higher CPL. Legal, insurance, and financial services are notoriously competitive. Niche industries with fewer advertisers typically have lower CPL.
3. Customer lifetime value: Industries where each customer is worth thousands of dollars can profitably spend more to acquire each lead. A law firm that averages $5,000 per client can profitably pay $100 per lead. A restaurant that averages $25 per visit can’t. Your acceptable CPL should always be a function of LTV, not industry averages.
How to Benchmark Your Own CPL
Stop comparing yourself to generic industry averages and start comparing to your own business economics. Here’s the simple test: calculate your CPL (total ad spend / total leads). Then calculate your lead-to-customer conversion rate. If your CPL is $50 and 20% of leads become customers, your cost per acquisition is $250. If your LTV is $750 (a 3:1 ratio), your CPL is healthy regardless of the industry average. If your LTV is $300 (1.2:1), your CPL needs improvement regardless of benchmarks.
According to McKinsey, companies that focus on LTV:CAC ratios rather than industry CPL benchmarks make more profitable marketing decisions. Industry benchmarks are useful context, but your own business economics should drive budget decisions.
How to Improve Your CPL in 30 Days
If your CPL is above the healthy range for your industry, here’s a 30-day improvement plan:
Week 1 — Audit: Pull your last 90 days of data. Identify which campaigns have the highest CPL and pause the bottom 20%. Focus on the channels and campaigns that deliver CPL within your target range.
Week 2 — Landing page optimization: A/B test your primary landing page. Change one element at a time: headline, form length, CTA button color, or page layout. According to Unbounce, a single landing page test can improve conversion rates by 20-50%, which directly reduces CPL.
Week 3 — Targeting refinement: Tighten your audience targeting. Remove locations, demographics, or interest segments with above-average CPL. Add lookalike audiences based on your best-converting customers.
Week 4 — Analysis and scale: Compare week 3 vs week 1 CPL data. Whatever improvements worked, scale them across all campaigns. Whatever didn’t work, revert and try a different approach. Repeat this cycle monthly.
Frequently Asked Questions
What is a good cost per lead for my industry?
Check the ranges above, but more importantly, calculate your own LTV:CAC ratio. A CPL that seems “high” by industry standards might be perfectly fine if your conversion rate and customer value are above average.
How to reduce cost per lead in my industry?
Start by improving your landing page conversion rate — this alone can reduce CPL by 20-40%. Then tighten targeting, improve ad relevance, and test different offers. Track your CPL trends monthly to catch increases early.
Is my cost per lead too high?
Calculate your lead-to-customer conversion rate. If your CPL × (1 / conversion rate) = cost per acquisition, and that number is less than 1/3 of your customer lifetime value, your CPL is fine. If not, optimization is needed.
How often do CPL benchmarks change?
CPL tends to rise 5-15% annually as competition increases across most industries. Platform changes (like iOS privacy updates) can cause sudden jumps. Review your CPL monthly and your industry benchmarks annually.
What to Do This Week
Take one practical step with the lead path from ad click to qualified conversation. Pull the last 30 to 90 days of spend, revenue, qualified leads, and any notes about promotions or sales changes. Then write one sentence that explains what you believe is happening. For example: “This channel is creating new demand,” “this campaign is capturing demand we already had,” or “this spend is not showing up in qualified outcomes.”
Next, choose a small test that could prove or disprove that sentence. That might mean trimming budget by 10%, changing the offer, separating branded from non-branded traffic, improving the landing page, or comparing platform-reported conversions with CRM results. Keep the test narrow enough that you can learn from it.
Once the path from click to qualified conversation is visible, the next improvement usually becomes obvious: fix the page, fix the offer, or stop buying traffic that never had a chance.
Leave a Reply