Cost per lead by industry in 2026 ranges from $15–$50 for e-commerce and local services to $150–$400+ for B2B enterprise and financial services — and your channel mix determines where you fall within that range. Google’s average CPL across all industries is $49; Facebook averages $29; LinkedIn averages $131; TikTok averages $18–$40 depending on targeting specificity. The key question isn’t whether your CPL is above or below average — it’s whether the leads your CPL produces convert to revenue at rates that justify the spend.
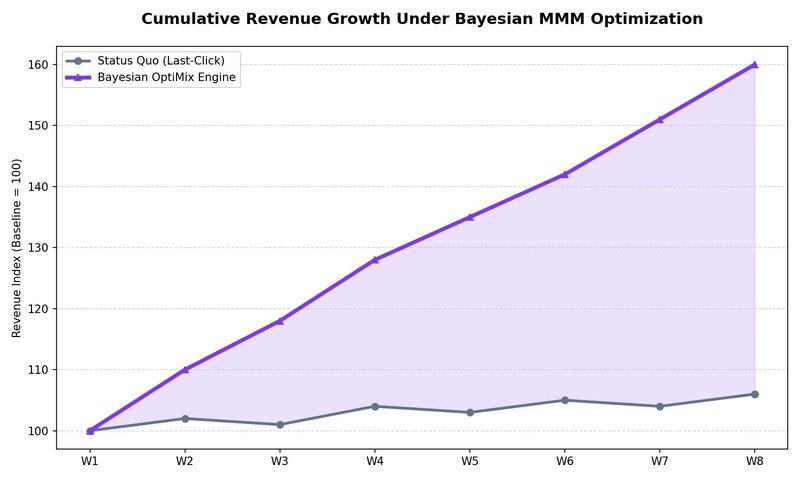
[Case Study: B2B SaaS, $90K Monthly Program] A B2B SaaS company spending $90K/month on LinkedIn and Google Ads used last-click attribution, which heavily credited LinkedIn’s bottom-funnel content. Bayesian MMM identified LinkedIn’s role as primarily awareness — it was influencing Google searches that last-click then credited to Google. After separating the channels by funnel stage and reallocating 25% of LinkedIn budget to upper-funnel Google targeting, demo requests increased 28% while cost-per-demo dropped from $340 to $218. The model showed LinkedIn’s actual contribution was 2.4× what last-click reported.
Benchmarks without context are misleading. A $200 CPL for LinkedIn lead generation in B2B software might be excellent if those leads have a 40% conversion rate to closed revenue. A $30 CPL for Google Ads in the same industry might be terrible if those leads have a 5% conversion rate and represent mostly competitors and researchers.
Use these benchmarks to understand where you stand relative to industry norms, then pair them with lead quality data from your CRM to determine true channel ROI. Tools like OptiMix can tell you not just whether your CPL differs from the benchmark, but which specific channel reallocations would bring your effective cost per qualified lead down.
Google Ads Cost Per Lead by Industry (2026)
| Industry | Average CPL | Low End | High End | Notes |
|---|---|---|---|---|
| Legal (Personal Injury) | $150–$400 | $90 | $600+ | Highest-cost lead gen vertical; high LTV justifies CPL |
| Financial Services (Insurance) | $60–$150 | $35 | $250 | Competitive; lead quality varies widely by carrier |
| Home Services (HVAC, Plumbing) | $35–$80 | $18 | $120 | Local service ads drive volume; competition varies by market |
| Healthcare | $50–$120 | $25 | $200 | Appointment setting; high competition in metro areas |
| B2B Software (SaaS) | $80–$200 | $40 | $350 | Demo request or free trial forms; keywords drive specificity |
| E-commerce | $15–$45 | $8 | $80 | Product catalog; lower CPL with Shopping ads |
| Education | $45–$100 | $20 | $180 | Online degree programs; competitive during enrollment periods |
| Automotive | $35–$90 | $18 | $150 | Service appointments; parts inquiries |
“Google Ads average cost-per-lead varies by industry due to competition intensity and customer lifetime value. Legal and financial services lead in CPL because individual lead values often exceed $1,000.” — Google Economic Impact Report, 2024
Google’s Quality Score and Ad Rank significantly affect where your CPL falls within these ranges. Advertisers with Quality Scores of 8+ typically pay 40–60% less per click than those with scores below 5 — which means conversion tracking, landing page alignment, and keyword specificity all directly impact your CPL.
Facebook Ads Cost Per Lead by Industry (2026)
| Industry | Average CPL | Low End | High End | Notes |
|---|---|---|---|---|
| E-commerce | $18–$40 | $8 | $75 | Lead Gen Forms dramatically reduce CPL vs. web traffic |
| Home Services | $25–$55 | $12 | $90 | Local targeting effective; Lead Gen Forms work well |
| B2B Software | $55–$120 | $25 | $200 | Job title + company size targeting narrows audience |
| Financial Services | $45–$100 | $20 | $180 | Lead Gen Forms reduce friction; compliance requirements |
| Healthcare | $35–$85 | $15 | $160 | Appointment booking; awareness vs. direct response |
| Legal | $60–$150 | $30 | $250+ | Audience restrictions limit targeting for some verticals |
| Education | $30–$70 | $15 | $130 | Lead Gen Forms for course inquiries |
Meta’s Lead Gen Forms average 2–3x higher conversion rates than equivalent landing page forms, primarily because the pre-filled profile data removes friction at the point of capture. For CPL-sensitive campaigns, using Lead Gen Forms instead of web-target campaigns can reduce cost per lead by 30–50% for the same offer and targeting.
LinkedIn Ads Cost Per Lead by Industry (2026)
| Industry | Average CPL | Low End | High End | Notes |
|---|---|---|---|---|
| B2B Software (Enterprise) | $130–$300 | $75 | $500+ | Decision-maker targeting; high LTV per lead |
| Professional Services | $100–$200 | $55 | $350 | Consulting, accounting, legal B2B |
| Financial Services (B2B) | $110–$250 | $60 | $400 | Investment, insurance, wealth management |
| Manufacturing | $90–$180 | $50 | $300 | Industrial equipment; longer sales cycles |
| Recruitment/Staffing | $40–$90 | $20 | $150 | Job posting and lead gen forms |
LinkedIn has the highest CPL of any major advertising platform — typically 4–5x Google and 3–4x Facebook. The justification is lead quality: LinkedIn leads convert to opportunities and revenue at higher rates than leads from other channels. For B2B businesses with 5-figure+ average deal sizes, LinkedIn’s higher CPL is often justified by the higher close rate.
OptiMix’s Bayesian ADVI quantifies the revenue-per-lead premium by channel, so you can determine whether LinkedIn’s higher CPL is actually producing better ROI than Google or Facebook — rather than guessing based on raw volume metrics.
TikTok Ads Cost Per Lead by Industry (2026)
| Industry | Average CPL | Low End | High End | Notes |
|---|---|---|---|---|
| E-commerce | $15–$35 | $6 | $60 | Product catalog and Lead Gen Forms |
| Local Services | $18–$45 | $10 | $75 | Interest-based targeting for local reach |
| B2B Software | $40–$90 | $20 | $150 | Emerging channel; less competition than Google/Meta |
| Education | $25–$55 | $12 | $100 | Interest + lookalike audience targeting |
| Consumer Finance | $30–$70 | $15 | $120 | Interest-based; behavior targeting for buyers |
TikTok’s CPL is 40–60% below equivalent Google or Meta campaigns for most industries, primarily because the platform has lower commercial intent per user. For lead generation, TikTok works best as an upper-funnel channel — building brand awareness and consideration that feeds leads through other channels downstream.
The critical caveat with TikTok: last-click attribution systematically under-values TikTok’s true contribution to your lead pipeline. Using multi-channel attribution with a 90-day lookback window, OptiMix clients typically find TikTok’s actual assisted-lead contribution is 2–3x what last-click credits.
What Is a Good Cost Per Lead? Context Beyond the Benchmark
A “good” CPL is not a universal number — it’s specific to your industry, your business model, and your lead-to-revenue conversion rate.
The formula for evaluating CPL quality:
Effective CPL = (CPL × 100) / (Lead-to-Opportunity Rate × Opportunity-to-Close Rate × Average Deal Size)
If your LinkedIn CPL is $150/lead but those leads convert to opportunities at 35% and closed deals at 25% with an average deal size of $50,000, your effective CPL per $1,000 of revenue is:
($150 × 100) / (35 × 0.25 × $50,000) = $0.34 per $1,000 in revenue
Compare this to Google Ads at $50 CPL with 15% opportunity rate and 10% close rate:
($50 × 100) / (15 × 0.10 × $50,000) = $0.67 per $1,000 in revenue
LinkedIn’s $150 CPL is actually twice as efficient as Google’s $50 CPL in this scenario — even though the raw CPL is 3x higher.
This is why cross-channel attribution with lead quality weighting is essential for evaluating CPL. Raw CPL benchmarks tell you whether you’re in the right ballpark; OptiMix’s lead-quality-weighted analysis tells you which channels to actually increase or cut.
How to Reduce Your Cost Per Lead
Once you have your benchmark context, the fastest ways to reduce CPL are:
1. Fix conversion tracking first. Businesses with broken tracking optimize to clicks, not leads — spending more on channels that look better only because their conversions are being missed. An audit of your conversion tracking (Google Tag Assistant test form submission) often reveals $20–$40 CPL reductions within 30 days.
2. Improve Quality Score on Google. Every point in Quality Score saves 5–15% on CPC. Tighten keyword groups, rewrite ad text to match intent, and improve landing page alignment. Quality Score 8+ advertisers pay 40–60% less per click than Quality Score 4 or below.
3. Switch to Lead Gen Forms on Meta and TikTok. If you’re still using web-target campaigns, switching to Lead Gen Forms reduces CPL by 30–50% by removing the landing page drop-off from the conversion path.
4. Reallocate from high-CPL, low-conversion channels. Use Bayesian attribution to identify channels where CPL is above benchmark AND conversion to opportunity rate is below average. Those channels should be the first targets for budget reduction.
5. Narrow targeting to high-intent audiences. On all platforms, broadening targeting wastes budget on low-intent users. Use interest stacking, lookalike audiences from your best existing customers, and retargeting layers to concentrate spend on users most likely to convert.
Frequently Asked Questions
Q: What is a good cost per lead?
A: A good cost per lead is one where the leads produced generate more revenue than they cost — meaning your effective cost per qualified lead (CPL weighted by lead-to-close rate and average deal size) is below your revenue threshold. A $200 CPL that converts at 40% to closed revenue at $50,000 average deal size is far better than a $30 CPL that converts at 5%. Use lead quality weighting, not raw CPL, to evaluate what’s actually good for your business.
Q: What is the average cost per lead by industry?
A: Average CPL ranges from $15–$45 for e-commerce and local services to $150–$400 for legal and B2B enterprise. Google Ads averages $49 across industries; Facebook averages $29; LinkedIn averages $131; TikTok averages $18–$40. Always compare your CPL to industry-specific benchmarks rather than cross-industry averages, and weight by lead quality to get true channel ROI.
Q: How do I reduce my cost per lead?
A: Reduce CPL by: (1) fixing broken conversion tracking — often the biggest CPL reducer; (2) improving Quality Score on Google Ads to lower CPC; (3) switching to Lead Gen Forms on Meta and TikTok to remove landing page drop-off; (4) using Bayesian attribution to reallocate from high-CPL, low-conversion channels; (5) narrowing targeting to high-intent audiences via interest stacking and lookalikes. The highest-impact first step is always conversion tracking audit.
Q: What is a good cost per lead for B2B vs B2C?
A: B2B CPL is typically 3–5x higher than B2C ($80–$300 for B2B software vs. $15–$45 for consumer e-commerce) because B2B deals have longer cycles, higher deal values, and require more consideration. But B2B leads also convert to revenue at higher rates — a $200 LinkedIn CPL that closes at 30% is more efficient than a $30 Google CPL that closes at 8%. Always evaluate CPL in the context of downstream conversion rates and deal sizes.
Further Reading & Sources
- arXiv — open-access research papers and preprints
- Deloitte — professional services and consulting
- Harvard Business Review — business management research
- McKinsey & Company — global management consulting
- Statista — statistics and market data
Owner’s Note
The practical question is whether the metric still makes sense after margin, lead quality, and incrementality are included. Before changing the budget, compare the article’s framework with your own last 30 to 90 days of spend, revenue, and qualified outcomes. The best next move should be small enough to test, clear enough to measure, and tied to profit rather than platform-reported activity.
Leave a Reply