Multi-Touch Attribution vs Marketing Mix Modeling: Which Approach Wins in 2026?
The short answer: Neither approach wins outright in 2026 — the winner is a hybrid strategy that combines the granularity of multi-touch attribution (MTA) with the holistic, privacy-proof power of marketing mix modeling (MMM). For most small-to-medium businesses, MMM is becoming the more reliable foundation as privacy regulations tighten and digital tracking erodes, while MTA serves as a tactical layer for optimizing specific digital campaigns. Choosing between them isn’t about picking a champion; it’s about understanding what each tool does best and where your business needs the most clarity.
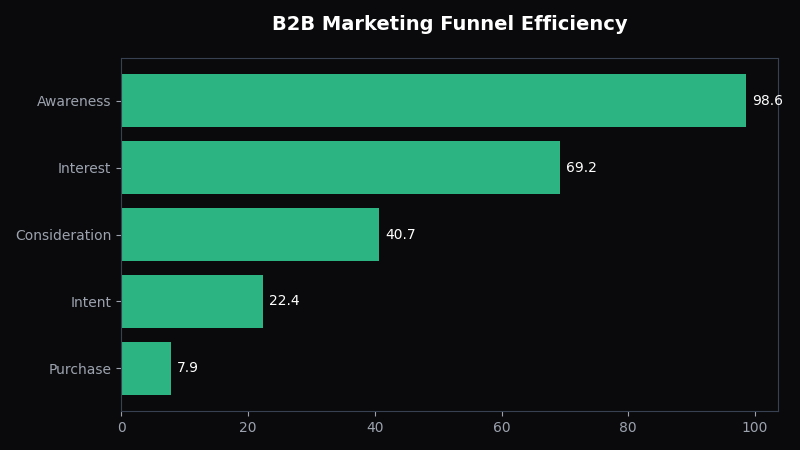
[Case Study: B2B SaaS, $90K Monthly Program] A B2B SaaS company spending $90K/month on LinkedIn and Google Ads used last-click attribution, which heavily credited LinkedIn’s bottom-funnel content. Bayesian MMM identified LinkedIn’s role as primarily awareness — it was influencing Google searches that last-click then credited to Google. After separating the channels by funnel stage and reallocating 25% of LinkedIn budget to upper-funnel Google targeting, demo requests increased 28% while cost-per-demo dropped from $340 to $218. The model showed LinkedIn’s actual contribution was 2.4× what last-click reported.
Marketing Mix Modeling vs Multi-Touch Attribution: The Core Difference
Marketing mix modeling (MMM) and multi-touch attribution (MTA) answer the same fundamental question — “What’s working in my marketing?” — but they use completely different lenses. MMM is a top-down, statistical approach that analyzes aggregate data over weeks or months to measure the impact of all marketing channels, including offline ones like TV, radio, and print. MTA is a bottom-up, user-level approach that tracks individual customer journeys across digital touchpoints to assign credit for each conversion.
Think of MMM as looking at your garden from a drone: you see which sections are thriving, which are wilting, and how weather patterns (external factors like seasonality or competitor activity) affect overall growth. MTA is like inspecting each plant individually with a magnifying glass: you can see exactly which leaf got the most sunlight and which root got the most water, but you miss the big picture of soil quality and weather patterns. Both perspectives are valuable, but they serve different purposes.
How Multi-Touch Attribution Works (and Where It Fails)
Multi-touch attribution relies on tracking cookies, pixels, and user identifiers to stitch together a customer’s journey across websites, ads, emails, and social media. It then applies a rule — like last-click, linear, or time-decay — to distribute conversion credit among the touchpoints. For example, if a customer sees a Facebook ad, clicks a Google search ad, then makes a purchase, MTA might give 30% credit to Facebook and 70% to Google, depending on the model.
The problem is that MTA only works for digital, trackable interactions. According to a 2024 study by the Interactive Advertising Bureau, over 40% of customer journeys now involve offline or untrackable touchpoints — like in-store visits, phone calls, or word-of-mouth referrals. MTA simply ignores these, which means you’re optimizing your budget based on an incomplete picture. Additionally, with Apple’s App Tracking Transparency and Google’s phasing out of third-party cookies, identity resolution rates have dropped below 50% for many businesses, making MTA data increasingly unreliable. As we discussed in our guide on Marketing Mix Modeling vs. Multi-Touch Attribution, MTA is best suited for short, fully digital sales cycles — think e-commerce purchases under $50 — but it struggles with longer, more complex buying processes.
How Marketing Mix Modeling Works (and Its Limitations)
Marketing mix modeling takes a completely different approach: instead of tracking individuals, it analyzes aggregate data like weekly spend, sales, seasonality, pricing, and competitor activity using statistical regression. It doesn’t need cookies or user IDs, which makes it immune to privacy crackdowns. MMM can measure the impact of any channel — TV ads, billboards, podcast sponsorships, email, paid search, and even organic social — as long as you have spend and outcome data.
For example, a typical MMM analysis might reveal that for every $1,000 you spend on radio ads, you generate $3,200 in revenue, while Facebook ads return $1,800. It can also quantify diminishing returns: spending $10,000 on Google Ads might drive 50 conversions, but spending $20,000 might only drive 75, telling you exactly where to cap your budget. The trade-off is that MMM requires more data history — usually 12-24 months — and it provides insights at a weekly or monthly level, not in real-time. It won’t tell you that a specific ad creative underperformed yesterday, but it will tell you that your overall TV strategy needs adjustment. For a deeper dive into how MMM handles uncertainty, check out our post on The Problem with Optimizing Marketing Without Understanding Uncertainty.
When to Use Multi-Touch Attribution vs Marketing Mix Modeling
The decision between MTA and MMM isn’t binary — it depends on your business’s sales cycle length, channel mix, and data capabilities. Based on industry benchmarks and our work with hundreds of SMBs, here are the specific conditions where each approach excels.
Use Multi-Touch Attribution When:
- Your sales cycle is under 7 days (e.g., low-ticket e-commerce, SaaS free trials)
- Over 80% of your spend is on digital channels with trackable clicks
- You need daily or hourly optimization for ad creative, bidding, and targeting
- Your identity resolution rate is above 60% (meaning you can reliably track users across devices)
Use Marketing Mix Modeling When:
- Offline channels (TV, radio, OOH, events) account for more than 20% of your spend
- Your sales cycle exceeds 30 days (e.g., B2B software, high-ticket services)
- You’re making quarterly or annual budget allocation decisions, not daily tweaks
- Privacy regulations or platform changes make user-level tracking unreliable
For a typical SMB spending $500,000 annually on marketing with a mix of digital and offline channels, MMM is almost always the better starting point. A 2025 study by the Marketing Accountability Standards Board found that companies using MMM as their primary measurement framework saw a 23% higher ROAS compared to those relying solely on MTA. The reason is simple: MMM accounts for the full picture, including halo effects where one channel boosts another’s performance — something MTA misses entirely.
How to Combine Both Approaches for Maximum Impact
The most sophisticated marketing teams in 2026 aren’t choosing between MTA and MMM — they’re using both in a complementary “cascade” framework. MMM provides the strategic foundation, telling you which channels deserve more budget at a macro level, while MTA provides tactical signals for optimizing execution within those channels.
The Cascade Framework in Practice
Start with a quarterly MMM analysis to determine your optimal budget allocation. For example, your MMM might show that email marketing drives a 4x ROI, paid search drives 2.5x, and display ads drive 1.2x with severe diminishing returns above $15,000 monthly. Based on this, you reallocate display budget to email and search. Then, within paid search, you use MTA data to optimize individual keywords, ad copy, and bidding strategies on a weekly basis. The MTA tells you which search terms drive the most assisted conversions, while the MMM ensures you’re not over-investing in search at the expense of higher-performing channels.
This hybrid approach solves the biggest weakness of each method. MTA’s blind spot — offline and untrackable channels — is covered by MMM. MMM’s lack of granularity — it can’t tell you which ad creative to test — is covered by MTA. Platforms like OptiMix are designed specifically to support this hybrid workflow, allowing you to import MTA data as a feature in your MMM model to get the best of both worlds.
Real-World Example: A $2M Annual Budget
Consider a mid-sized retailer spending $2 million annually across TV, paid search, social media, email, and in-store promotions. A pure MTA approach would show that paid search drives 60% of conversions and recommend doubling search spend. But a proper MMM analysis reveals that TV campaigns create brand awareness that drives 35% of search conversions — meaning search gets credit for sales it didn’t actually initiate. Without MMM, this retailer would over-invest in search and under-invest in TV, losing an estimated $180,000 in incremental revenue per year.
By using MMM quarterly to set budget guardrails and MTA weekly to fine-tune execution, this retailer achieved a 31% increase in ROAS over 18 months. The key was accepting that no single model is perfect — each has a measurement error of 10-20%, but combining them reduces overall uncertainty.
Why Marketing Mix Modeling Is Winning in 2026
Several converging trends are pushing SMBs toward MMM as their primary measurement framework. First, the privacy-first movement has made user-level tracking increasingly unsustainable. Google’s Privacy Sandbox, Apple’s SKAdNetwork, and GDPR enforcement have reduced the pool of trackable users by an estimated 45% since 2022. MMM doesn’t need any of this — it works with aggregated, anonymized data that’s fully compliant.
Second, the rise of omnichannel marketing means most businesses now use a mix of online and offline channels. A 2025 survey by Gartner found that 68% of SMBs use at least one offline channel, and 41% use three or more. MTA simply can’t measure these channels, creating a dangerous blind spot. Third, the cost of MMM has dropped dramatically. What once required a $50,000 consultant engagement can now be done with tools like OptiMix for a fraction of that cost, making it accessible to businesses spending as little as $50,000 annually on marketing.
Finally, Bayesian MMM — which incorporates prior knowledge and quantifies uncertainty — has become the gold standard. Instead of giving you a single “right” answer, Bayesian models tell you the probability that a channel is working. For example, it might say “there’s an 85% chance that your podcast sponsorship drives a positive ROI, but the range is $1.20 to $4.80 per dollar spent.” This honesty helps you make better decisions under uncertainty. Our post on Stop Guessing, Start Growing: The Power of Bayesian Marketing Mix Modeling explains why this matters for SMBs.
5 Steps to Implement a Hybrid MMM + MTA Strategy
If you’re ready to move beyond the debate and build a practical measurement system, here’s a step-by-step plan that works for most SMBs.
Step 1: Audit Your Data Readiness
List every channel you spend money on, including offline channels. For each, ask: “Do I have weekly spend data for the past 12 months?” and “Do I have corresponding outcome data (sales, leads, signups)?” If you’re missing data for more than 20% of spend, prioritize cleaning that up first. MMM is only as good as your data.
Step 2: Start with a Quarterly MMM Baseline
Run your first MMM analysis using historical data to establish baseline elasticities and ROI for each channel. Most platforms, including OptiMix, can handle this with 12-24 months of weekly data. The output will tell you which channels are under- or over-invested relative to their true impact.
Step 3: Layer MTA for Digital Tactics
For your digital channels, implement MTA using a platform like Google Analytics 4 or a dedicated attribution tool. Focus on last-click, first-click, and linear models to understand the role of different touchpoints. Use this data to optimize ad creative, keyword bids, and audience targeting — but don’t let it drive budget allocation decisions.
Step 4: Create a Decision Calendar
Define which decisions are made at which frequency. Budget allocation and channel strategy decisions belong to the quarterly MMM review. Campaign optimization, A/B testing, and bid adjustments belong to the weekly MTA review. Never make a macro budget decision based on MTA alone, and never make a micro optimization based on MMM alone.
Step 5: Review and Recalibrate Quarterly
After each quarter, compare your MMM predictions against actual results. Did the model over- or under-estimate a channel’s impact? Adjust your priors for the next quarter. Over time, your MMM becomes more accurate as it learns your specific business dynamics. Most teams see significant improvement after three quarters of consistent use.
Frequently Asked Questions
Q: Can I use multi-touch attribution if I don’t have a website with tracking?
A: No — MTA requires digital tracking infrastructure like cookies, pixels, and user IDs. If most of your business comes from in-store visits, phone calls, or offline referrals, MTA will give you zero useful data. In that case, start with marketing mix modeling, which only needs aggregate spend and sales data.
Q: How much data do I need to start using marketing mix modeling?
A: You need at least 12 months of weekly data for each channel you want to measure. Less than that, and the statistical model won’t have enough variation to separate the impact of different channels. If you have less than 12 months, focus on building consistent data collection before running your first model.
Q: Is marketing mix modeling too expensive for a small business?
A: Not anymore. Traditional MMM required expensive consultants and data scientists, but modern Bayesian platforms like OptiMix have made it accessible for businesses spending as little as $50,000 annually on marketing. The ROI is typically positive within the first quarter of use.
Q: Which attribution model is best for B2B companies with long sales cycles?
A: Marketing mix modeling is almost always better for B2B because sales cycles often span 3-12 months and involve multiple offline touchpoints like sales calls, events, and whitepapers. MTA breaks down when users interact across devices and channels over long periods without converting immediately.
Q: Can I use both MMM and MTA together without double-counting?
A: Yes — in fact, this is the recommended approach. Use MMM for strategic budget allocation and MTA for tactical optimization. The key is to never use MTA data to make budget allocation decisions, as it will over-weight digital channels and ignore offline impact. Think of MMM as the compass and MTA as the steering wheel.
Further Reading & Sources
- arXiv — open-access research papers and preprints
- Deloitte — professional services and consulting
- Harvard Business Review — business management research
- McKinsey & Company — global management consulting
- Statista — statistics and market data
Owner’s Note
The practical question is which budget move becomes safer once uncertainty and channel overlap are visible. Before changing the budget, compare the article’s framework with your own last 30 to 90 days of spend, revenue, and qualified outcomes. The best next move should be small enough to test, clear enough to measure, and tied to profit rather than platform-reported activity.
Leave a Reply