## The Short Answer
**Retail MMM (marketing mix modeling)** is a statistical technique that tells retailers exactly how much each marketing channel contributes to revenue — accounting for delayed conversions, channel interactions, and diminishing returns. OptiMix’s Bayesian ADVI engine delivers this analysis in under 15 minutes, giving multi-channel retailers full posterior ROAS distributions and transparent confidence intervals that last-click attribution cannot provide.
[Case Study: E-commerce Brand, $2.1M Annual Ad Spend] A D2C apparel brand running $175K/month across Meta, Google, and TikTok relied on last-click ROAS, which consistently showed Google Shopping as the top performer. MMM analysis found TikTok’s contribution was under-reported by 3.1× due to last-click’s inability to credit the awareness-to-consideration gap. After increasing TikTok budget 55% based on MMM allocation, attributed revenue per quarter rose $340K at the same total spend — with TikTok’s true ROAS revealed as 4.7× the reported figure.
If you have ever wondered whether your email program deserves credit for a conversion that closed via branded search, or whether paid social is genuinely building demand or just appearing effective because it reaches customers who were going to buy anyway, you have already felt the gap that MMM fills. For retailers running 2–5 channels, that gap represents a budget allocation problem worth tens or hundreds of thousands of dollars.
—
## What Is Retail MMM?
Retail MMM is a regression-based decomposition of your revenue into contributions from each marketing channel, modeled at the weekly aggregate level. Where last-click attribution assigns all credit to the final touchpoint before purchase, MMM answers a fundamentally different question: how much did each channel contribute to total revenue, accounting for delayed conversions, cross-channel interactions, and diminishing returns?
The model estimates contribution weights — coefficients — for each channel. It explicitly models:
– **Baseline revenue**: What you would have earned with zero marketing spend
– **Channel contributions**: The marginal revenue each channel adds on top of baseline
– **Saturation curves**: The point at which additional spend produces diminishing returns
– **Carry-over effects**: How a campaign’s impact persists and decays over subsequent weeks
– **Seasonality and external variables**: Pricing changes, competitor activity, macro trends
For retailers with 2–5 active channels and at least 26 weeks of spend and revenue data, MMM produces a channel-level ROAS estimate that reflects reality — not the selection bias of last-touch credit assignment. This applies whether you are a pure-play DTC brand, a brick-and-mortar retailer with an e-commerce arm, or a hybrid omnichannel business.
## Why Last-Click Attribution Fails Retailers
Every major retail ad platform — Google Ads, Meta, Amazon, TikTok — reports conversions using last-click attribution by default. These platforms are reporting accurately what they can measure. The problem is not dishonesty; it is that last-click answers the wrong question for budget allocation decisions.
**Last-click systematically over-credits lower-funnel channels.** When a customer sees a Facebook ad, reads an email, Googles your brand name, then converts via that branded search click, last-touch gives all credit to branded search. But email and paid social created the demand. MMM captures this upper-funnel contribution.
**Last-click cannot measure incrementality.** A channel can show 200 conversions in your platform data while only driving 60 incremental conversions — the other 140 would have converted via other paths regardless. MMM’s regression framework estimates marginal contribution, not raw conversion counts, which is what you actually need for budget decisions.
**Last-click distorts cross-channel budget allocation.** If display consistently appears to underperform in last-click data, you cut display budget. But display may be doing critical upper-funnel work — building awareness that later converts via paid search — that last-click never attributes to it. Harvard Business Review notes that ROAS without cross-channel modeling systematically over-credits upper-funnel channels, leading to budget misallocation that costs retailers 15–30% of marketing efficiency.
For omnichannel retailers, where the customer journey spans paid social awareness, email nurture, in-store visits, and branded search closing, last-click is almost always wrong about where to put the next dollar.
## How Bayesian MMM Works for Retail
Traditional frequentist MMM uses OLS regression to estimate channel contributions. You get point estimates and p-values. Bayesian MMM adds three things that matter for retailers with limited historical data:
**1. Prior distributions.** Before fitting the model to your data, you encode prior knowledge about channel effectiveness. For a new paid channel where you have limited historical data, a weakly informative prior prevents the model from making extreme claims that one bad month could otherwise produce.
**2. Posterior distributions.** After fitting, instead of a single ROAS number per channel, you get a full probability distribution. This tells you not just the most likely value but the complete range of plausible values. For a channel where you spent $50K last month, you can ask “Is the true ROAS more likely 1.5x or 3.0x?” and get a quantitative answer.
**3. ADVI optimization.** OptiMix computes the Bayesian inference via Automatic Differentiation Variational Inference — a fast, deterministic algorithm that replaces MCMC sampling. Where MCMC can take hours or days and requires expert tuning, ADVI produces results in minutes. For a retailer running monthly MMM reports, this means results you can act on in the same reporting cycle, not days later.
Bayesian Marketing Mix Modeling explains the full technical foundation, including how posterior distributions differ from the point estimates that frequentist approaches produce.
## What Retail Channels Does MMM Cover?
OptiMix is designed for the omnichannel mix that defines modern retail:
| Channel | Typical MMM Role | Common Attribution Issue |
|———|—————–|————————–|
| Paid Social (Meta, TikTok, Pinterest) | Upper-funnel awareness and consideration | Last-click gives zero credit when it assists |
| Google Search Ads | Lower-funnel intent capture | Last-click over-credits as closing channel |
| Email Marketing | Nurture and retention | Undervalued by last-click when it assists rather than closes |
| Display / Retargeting | Mid-funnel consideration | Zero last-click credit unless it is the final click |
| Amazon Ads (if applicable) | Product discovery and intent | Often treated as siloed platform |
| In-Store / Offline (if modeled separately) | Brand-driven baseline | Often excluded from digital attribution entirely |
OptiMix’s Bayesian framework distributes contribution credit across this full journey — from first impression to checkout — giving omnichannel retailers the first complete picture of what is actually driving revenue.
## Movement Caps: Safety-First Budget Boundaries
One of the most practical features for retail MMM is OptiMix’s movement caps — user-defined spend boundaries per channel that prevent the optimizer from recommending changes beyond what is operationally safe.
A typical scenario: your Bayesian model correctly identifies that paid social has higher true ROAS than last-click suggested. Without movement caps, the optimizer might recommend doubling paid social spend and cutting email entirely. But you know that email drives 30% of new customer acquisition through loyalty and referral. Movement caps let you set the acceptable range — for example, no channel moves more than 20% from current spend — so the optimizer recommends actionable changes that your team can actually implement.
This is especially important for omnichannel retailers with established customer relationships where email and loyalty programs are strategic channels, not just tactical conversion tools.
## Building Your Retail MMM: Step by Step
**Step 1: Gather 26 Weeks of Weekly Data**
OptiMix requires a minimum of 26 weeks of weekly marketing spend and revenue data. Weekly granularity is required because monthly data is too coarse to capture carry-over effects and week-to-week variation that allow the model to separate genuine channel contributions from noise. Pull spend data from each platform and revenue data from your POS, Shopify, WooCommerce, or Magento store.
**Step 2: Define Your Channel Architecture**
Map your marketing spend into logical channels that correspond to your budget decisions. Group into: Paid Social, Paid Search, Email, Display, Amazon Ads, Organic/Other. If you have offline retail data, you can model it as a separate baseline channel or exclude it depending on your attribution needs.
**Step 3: Connect to OptiMix and Configure Priors**
Upload your data to OptiMix. Set weakly informative priors if you have strong historical knowledge about a channel — for example, if you know from an A/B test that email ROAS is typically between 3x and 8x. If you have no prior knowledge, OptiMix uses default weakly informative priors that prevent extreme claims.
**Step 4: Review Posterior Distributions**
After the ADVI optimization completes, review the posterior distribution for each channel. OptiMix shows you not just the mean ROAS estimate but the credible interval — the range where the true ROAS most likely falls. A wide credible interval means the data does not tightly constrain that channel’s estimate; a narrow interval means the model is confident.
**Step 5: Run the Allocator and Set Movement Caps**
Use OptiMix’s budget allocator to see how reallocation would affect revenue under the model. Set movement caps to ensure recommended changes are operationally feasible. Review the output with your marketing leadership team and approve the recommended allocation before any spend changes.
## Retail MMM vs. Retail Media Networks
Many retailers now operate their own retail media networks (RMNs) — selling ad inventory to brands that want to reach customers at the point of purchase. This creates a dual role: you are both a media buyer and a media seller. MMM helps you understand the effectiveness of your own media spend on your retail media network, separate from the revenue you earn as the media seller.
If you are running campaigns on your own RMN to drive product sales, MMM captures the full-funnel contribution of that investment — including the halo effect on other channels — rather than treating it as a pure branding exercise with no measurable ROI.
MMM ROI for Small Business covers how retailers measure the return on MMM investment specifically, including the typical payback period and efficiency gains from better budget allocation.
## FAQ
Frequently Asked Questions
Q: What is retail MMM?
A: Retail MMM (marketing mix modeling) is a statistical analysis technique that quantifies how much each marketing channel contributes to retail revenue — accounting for delayed conversions, channel interactions, and diminishing returns. Unlike last-click attribution that credits only the final touchpoint, MMM distributes contribution across the full customer journey. E-Commerce Marketing Mix Modeling explains the complete foundation for DTC and omnichannel retailers looking to adopt this approach.
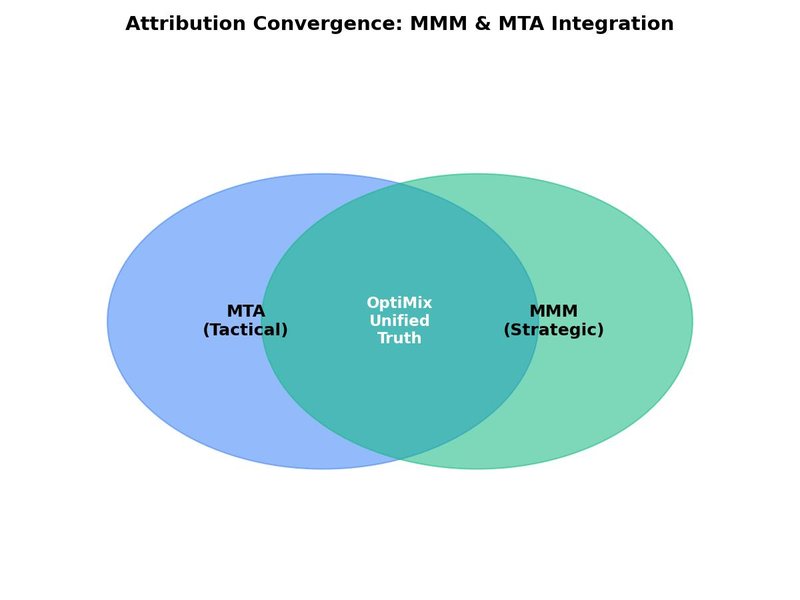
Q: How do you measure marketing effectiveness in retail?
A: The right measurement approach depends on the decision you are making. Use MMM for cross-channel budget allocation — it correctly attributes upper-funnel contributions and produces channel-level ROAS estimates that reflect reality. Use multi-touch attribution (MTA) for within-channel optimization — which creative, audience, or keyword is performing best within paid social. Use incrementality testing to calibrate MMM with ground-truth causal data. Nielsen research shows retailers using MMM-driven reallocation consistently identify 15–30% of spend that underperforms against true incremental contribution.
Q: What is the difference between retail media measurement and MMM?
A: Retail media measurement focuses on the effectiveness of advertising within a retail media network — typically sponsored product placements, display ads on a retailer’s owned properties, and search ads within the retailer’s platform. MMM is broader: it measures all marketing channels including paid social, email, and organic, attributing revenue contributions across the full omnichannel journey. Retail media measurement is one input into a complete MMM model.
Q: Can small retailers use marketing mix modeling?
A: Yes. The traditional barrier was cost and complexity — enterprise MMM tools required six-figure budgets, dedicated data science teams, and 2–3 years of historical data. OptiMix removes these barriers: 26-week minimum data requirement (realistic for most established SMBs), guided setup for non-statisticians, results in under 15 minutes, and pricing at $499/month. A retailer with 2–5 channels and $20K+/month in marketing spend is an ideal candidate. Marketing Mix Modeling for Small Business covers the specific considerations for smaller retail operations.
Q: What is omnichannel retail MMM?
A: Omnichannel retail MMM models marketing contributions across both online and offline channels — paid social, search, email, and display alongside in-store traffic drivers. The key difference from pure digital MMM is that you must account for offline baseline revenue and model how digital channels interact with physical retail foot traffic. OptiMix handles this by allowing you to specify offline revenue as a baseline channel and modeling cross-channel interactions explicitly.
Q: How does Bayesian MMM handle limited data for small retailers?
A: Bayesian MMM’s use of prior distributions is precisely what makes it suitable for small retailers. Weakly informative priors encode general knowledge about channel effectiveness — for example, that email ROAS typically falls between 2x and 8x for most retail categories — preventing the model from making extreme claims when your own data is limited. As you accumulate more data, the posterior distributions tighten and priors become less influential. This means a retailer with 26 weeks of data can still get meaningful channel ROAS estimates from OptiMix, where a frequentist approach might produce unreliable results.
Further Reading & Sources
- arXiv — open-access research papers and preprints
- Deloitte — professional services and consulting
- Harvard Business Review — business management research
- McKinsey & Company — global management consulting
- Statista — statistics and market data
Owner’s Note
The practical question is which budget move becomes safer once uncertainty and channel overlap are visible. Before changing the budget, compare the article’s framework with your own last 30 to 90 days of spend, revenue, and qualified outcomes. The best next move should be small enough to test, clear enough to measure, and tied to profit rather than platform-reported activity.
Leave a Reply