For a complete diagnosis of this issue, see our guide to The Wasted Ad Spend Diagnosis Framework — the 6-step diagnosis framework for identifying waste.
Why am I wasting money on ads is usually a cross-channel attribution problem, not a single-platform problem. Most advertisers diagnose waste by looking at Google Ads, then Meta, then TikTok separately — and in each dashboard, the numbers look defensible. The problem emerges when you compare them: each platform credits itself for the same conversion, your total attributed conversions exceed your actual conversions, and 15–25% of your budget is funding double-credited, non-existent sales.
## The Cross-Channel Waste Map: Where the Money Actually Goes
Cross-channel waste is invisible inside individual platform dashboards. Here’s why:
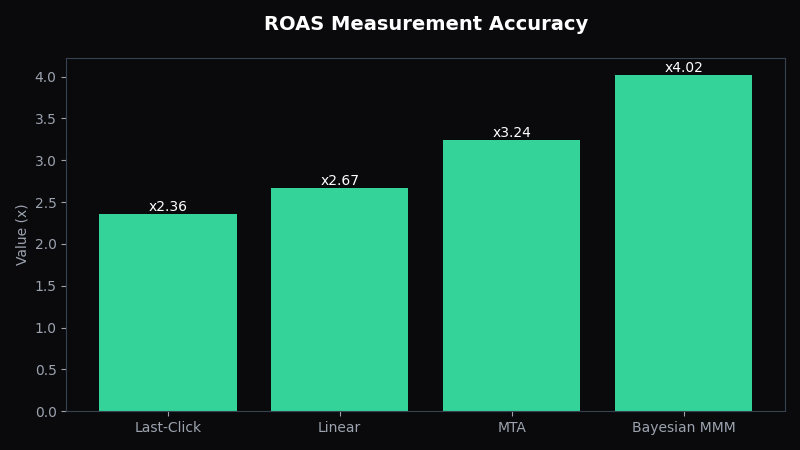
[Case Study: Retail Chain, Unified Measurement] A 35-door retail chain had separate reporting for Google Ads, Meta, email, and in-store — no unified attribution model. Last-click showed email as the top performer at 4.8× ROAS, driving most budget decisions. Bayesian MMM run across all channels revealed email’s apparent performance was heavily inflated by last-click attribution — it was capturing conversions that Meta and Google had initiated. After implementing MMM and reallocating 27% from email to upper-funnel paid channels, total conversions rose 18% and marketing efficiency improved by $52K/month.
– **Google Ads** reports conversions via its own pixel — if a customer first searched on Google, visited your site directly three weeks later, and converted, Google gets the credit
– **Meta Ads** reports conversions via the Meta pixel — if a Facebook impression preceded a conversion by any path, Meta may claim it
– **TikTok Ads** is the newest to attribution and often over-credits upper-funnel views
The result is a **multiplied conversion count** that makes every channel look profitable on its own. Meanwhile, you’re probably funding channels that are genuinely helping (the mid-funnel channels that create consideration) with channels that are merely capturing credit (last-touch platforms). Per McKinsey’s marketing effectiveness research, companies relying on last-touch attribution systematically overcredit upper-funnel channels and underinvest in mid-funnel ones, wasting 15–25% of budget on misattributed conversions.
## Diagnosing Google Ads Waste
Google Ads waste typically comes from four sources: irrelevant broad match queries, campaigns running without a ROAS floor, device bid misalignments, and Quality Score deterioration raising effective CPC.
Start with your Search Terms report — if more than 20% of your spend is going to queries with zero conversion, add those as negatives immediately. Then check your device split: if mobile accounts for 45% of spend but 15% of conversions, your device bid adjustment is backwards.
The fastest fix: switch any campaign with CPA above 2× break-even from Maximize Clicks to Target ROAS with a floor at your break-even ROAS. This one change typically cuts CPA by 15–25% within 14 days.
## Diagnosing Meta (Facebook + Instagram) Ads Waste
Meta waste typically clusters around three problems: **audience staleness** (interest-based audiences built 18+ months ago are exhausted), **creative fatigue** (same ad running for 6+ weeks with no refresh), and **automated bidding misalignment** (advantage+ campaigns optimizing for the wrong objective).
Check your Creative: in Ads Manager, look at frequency per creative set. If frequency is above 3.5 for a bottom-funnel offer, your audience has seen the same creative too many times and CPM is rising with no corresponding CTR improvement. Pause that creative and launch a new one with different imagery and hook.
Meta’s Advantage+ shopping campaigns have improved significantly in 2025–2026, but they’re still best suited for direct-response e-commerce with 50+ weekly conversions. For lower-volume accounts, split-test Advantage+ against manual campaign structure.
## Diagnosing TikTok Ads Waste
TikTok waste is primarily a targeting and creative alignment problem. If your TikTok ads aren’t converting, the most common causes are:
1. **Creative doesn’t match platform norms** — users swipe past ads that look like TV commercials
2. **Targeting is too broad or too interest-based** — TikTok’s algorithm performs best when given a signal of intent (search activity, lead form interactions, or video engagement similar to your existing customers)
3. **Funnel mismatch** — TikTok users aren’t ready to buy on first exposure; they need retargeting
TikTok’s paid attribution window defaults to 1-day click, which undercredits its contribution. Check your TikTok Analytics → Attribution to see 7-day and cross-channel attribution — you may find TikTok is contributing to conversions that its own dashboard reports as zero.
## The Attribution Gap: Why Single-Channel Reports Lie to You
The single biggest reason you’re wasting money on ads is that **last-touch attribution treats mid-funnel influence as zero**. If a customer saw your Facebook ad, Googled your brand name, and clicked a Google retargeting ad to convert, your Google ad gets 100% of the credit — even though Facebook created the awareness.
This leads to three systematic misallocations:
– **Overfunding last-touch channels** (usually paid search and direct)
– **Underfunding upper and mid-funnel channels** (usually social and display)
– **Budget concentrated at the bottom of the funnel** when the highest ROAS often lives in the middle
The solution isn’t to stop using last-touch platforms — it’s to use a measurement system that models the full journey. Data-driven attribution (DDA) in Google and Meta attempts this but is limited to their own ecosystems. Cross-channel Bayesian Marketing Mix Modeling (MMM) models all channels simultaneously against your actual revenue, accounting for ad stock (carryover effects) and simultaneous causality.
## How to Build a Cross-Channel Waste Estimate in 5 Steps
**Step 1: Normalize all channel data to the same time window.** Pull spend and revenue from Google Ads, Meta Ads, TikTok Ads, LinkedIn Ads, and any other paid channel into a single spreadsheet with columns: Channel, Week, Spend, Revenue. Use 26 weeks minimum — any shorter and your model will overfit to noise.
**Step 2: Assign credit using data-driven attribution or a custom model.** If you have access to Google Analytics 4 attribution comparison, use the “data-driven” model. If not, estimate a weighted attribution: give 40% credit to the last-touch channel, 30% to first-touch, and distribute the remaining 30% across the other touchpoints in the path.
**Step 3: Calculate a waste proxy for each channel.** Waste % = 1 − (channel-attributed ROAS ÷ break-even ROAS). If your break-even ROAS is 3:1 and Google Ads shows 2.4:1, your Google waste is approximately 20%.
**Step 4: Find the channel with the highest waste-to-ROI ratio.** This is your highest-priority reallocation candidate — but don’t cut it entirely. Often the channel with apparent high waste is also creating conversions in other channels that don’t show up in its own dashboard.
**Step 5: Build a reallocation priority list.** Prioritize by waste × reach: channels that have high waste AND high spend contribute the most absolute waste dollars. Cut those first, but always maintain a holdout test to verify the cut didn’t hurt overall conversions.
## The One Question That Reveals 80% of Cross-Channel Waste
Ask this for every major channel: **”If I turned this off tomorrow, would my overall conversions drop?”**
If the answer is “probably not” (because the conversions would come through another channel), you have your waste signal. If the answer is “yes, immediately,” that’s a channel that deserves its budget. This question, applied across all your paid channels, typically surfaces 2–3 channels that are taking budget but not causally contributing to your bottom line.
OptiMix’s Bayesian ADVI engine answers this question quantitatively — not as an opinion, but as a posterior probability distribution per channel, with confidence intervals. Book a free diagnosis at [OptiMix](https://optimix.aureliansystems.tech) — the model runs on your actual data in under 30 minutes.
—
Frequently Asked Questions
Q: Why am I wasting money on ads across multiple channels?
A: Most cross-channel waste comes from two root causes: single-channel reporting silos and last-touch attribution. Each platform shows you its own conversions, so Google gets credit for sales that started on Facebook. Meanwhile, your TikTok budget looks profitable in TikTok’s dashboard because it drove awareness that converted elsewhere — but TikTok’s own conversion pixel recorded nothing. The result: every channel looks okay in isolation; your total ROI is worse than any single channel suggests. According to McKinsey, companies relying on last-touch attribution systematically overcredit upper-funnel channels and underinvest in mid-funnel ones, wasting 15–25% of their budget on misattributed conversions.
Q: How do I diagnose wasted spend across Google, Meta, and TikTok?
A: Use the 5-step cross-channel audit: (1) normalize all channel data to the same 26-week window, (2) map the customer journey across touchpoints using multi-touch data, (3) calculate a waste proxy per channel using ROAS vs. break-even, (4) identify the channel with the highest waste-to-revenue ratio, and (5) build a reallocation priority list. Bayesian MMM automates steps 1–4 by modeling all channels simultaneously and returning a posterior waste distribution per channel — no manual spreadsheet required.
Q: What are the most common causes of wasted ad spend?
A: Four causes dominate across every channel: (1) campaign targeting that’s too broad and showing ads to people far from purchase intent, (2) creative fatigue inflating CPM while click-through rates collapse, (3) automated bidding misaligned with actual business goals (e.g., maximize clicks on a revenue target), and (4) attribution models that credit the last touch instead of the full journey. According to McKinsey, companies using Bayesian MMM to reallocate budgets achieve measurably higher marketing ROI than those relying on single-touch attribution.
Further Reading & Sources
- arXiv — open-access research papers and preprints
- Deloitte — professional services and consulting
- Harvard Business Review — business management research
- McKinsey & Company — global management consulting
- Statista — statistics and market data
Owner’s Note
The practical question is the decision this article points to. Before changing the budget, compare the article’s framework with your own last 30 to 90 days of spend, revenue, and qualified outcomes. The best next move should be small enough to test, clear enough to measure, and tied to profit rather than platform-reported activity.
Leave a Reply